Welcome to KVFinder-web!
A web application for cavity detection and characterization in any type of biomolecular structure.
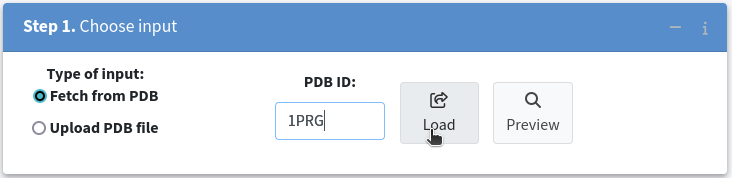
Step 1. Choose input
-
Cavity detection can be perfomed in two ways:
1. Fetch a structure from the Protein Data Bank (PDB) using a PDB ID;
2. Upload a PDB file from your computer.
In both options, the structure is screened for non-standard protein or nucleic acid residues, such as water, ligands, and ions.
By default, KVFinder-web removes all non-standard protein residues from the input. For example, if a target pocket contains a ligand, that ligand is automatically excluded before computing the cavity.
However, in specific situations, you may want to evaluate a portion of a cavity that includes a ligand, water, or ions. In such cases, you can use the 'Include' option to incorporate the non-standard residue into the biomolecular surface for cavity analysis.
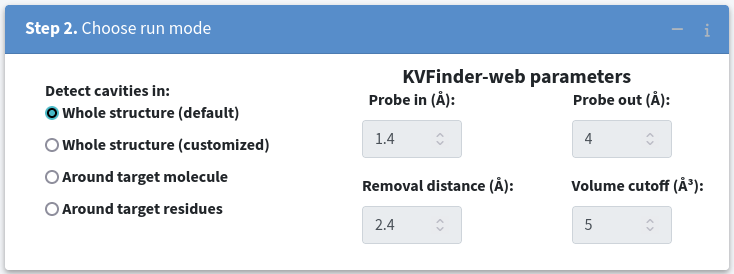
Step 2. Choose run mode
KVFinder-web parameters
KVFinder-web parameters
KVFinder-web parameters
KVFinder-web parameters
-
In this card, you can choose and configure the mode of your KVFinder-web job. There are four available modes:
1. Whole protein mode (default): KVFinder-web will use preset parameters to detect cavities across the entire biomolecular structure.
2. Whole protein mode (customized): This mode allows you to tailor the parameters for cavity detection across the entire biomolecular structure. Helpful tooltips are provided when you hover over each parameter.
3. Around target molecule mode: This mode specifically detects cavities around a chosen target molecule, focusing the search on the region surrounding that molecule.
4. Around target residues mode: In this mode, you can focus on detecting cavities within a custom box defined by selecting specific residues within the target biomolecular structure.
Get latest results
-
Here, you can insert a job ID to get or check your latest results.
Tutorial
Welcome to the KVFinder-web tutorial! This section provides an overview of the features available through our publicly available KVFinder-web service at kvfinder-web.cnpem.br .
In this tutorial, we will guide you through the four execution modes of KVFinder-web, allowing you to identify and characterize cavities in biomolecular structures. We will also explain how to retrieve results using job IDs.
For this tutorial, we will use two biomolecular structures identified by their PDB IDs:
By the end of this tutorial, you should have a clear understanding of how to employ KVFinder-web for cavity detection and characterization in your own biomolecular structures.Cavity Analysis
To start your cavity analysis, go to the Run Cavity Analysis tab.
Next, load your target biomolecular structure in Step 1. Choose Input by selecting Fetch from PDB as the input type and entering the PDB ID in the text box. For instance, to analyze the human Peroxisome Proliferator Activated Receptor Gamma (1PRG), enter 1PRG and click Load .
Once the structure is loaded, you will have the option to keep non-standard residues, such as water, ligands, and ions.
In the case of the 1PRG example, we do not want to include water molecules in further analysis, so please leave the HOH checkbox unchecked.

Now, let us explore the four different execution modes, that are:
- Whole structure (default)
- Whole structure (customized)
- Around target molecule
- Around target residues
1. Whole structure analysis with default parameters
This mode is designed for a quick and straighforward cavity detection across the whole structure. To use it, select Whole structure (default) in Step 2. Choose run mode
To submit a job for cavity analysis, simply click the Submit the job button.
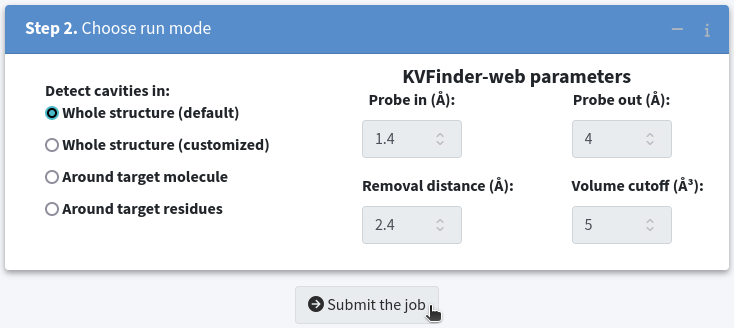
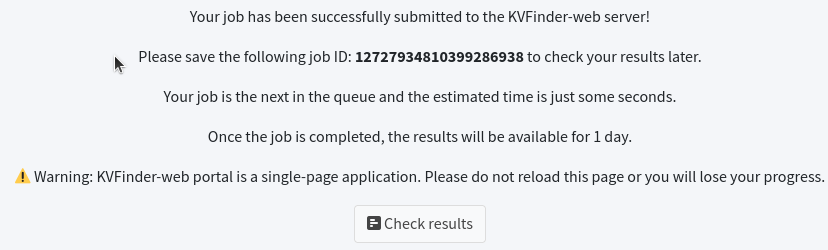
Upon successfully submitting the job to the KVFinder-web service, a window will display your Job ID . For example, the Job ID for our submission is 12727934810399286938 . To check your submission, click the Check Results button.
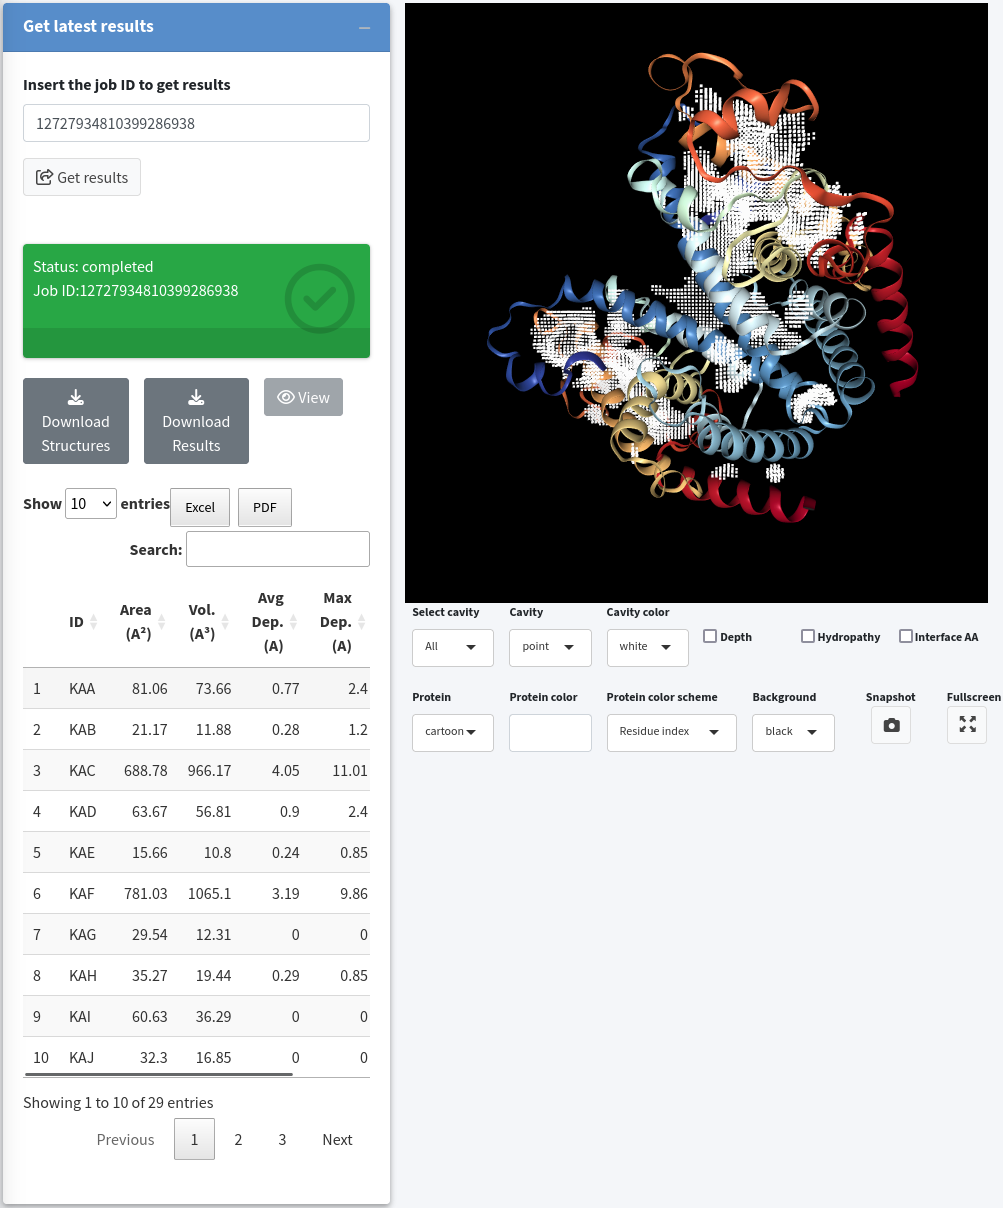
Once the analysis is complete, the Status field will switch to completed and turn green, indicating that the job has finished processing. You will then see the following three buttons along with a table displaying cavity characterizations:
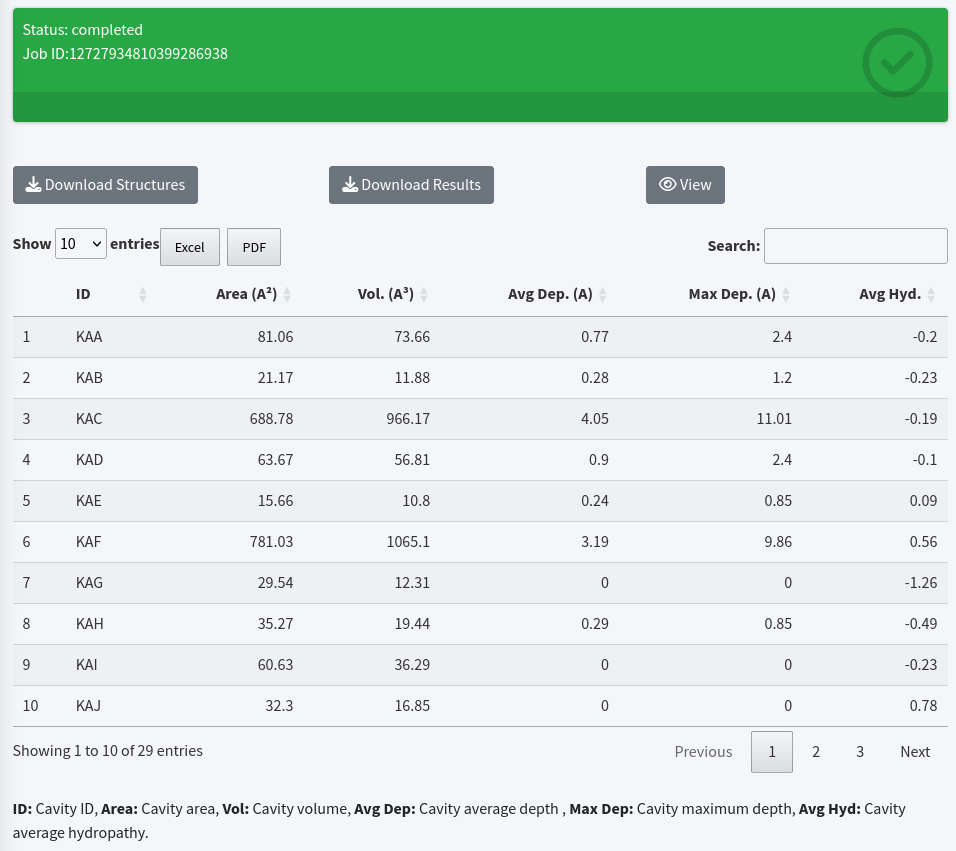
- Download Structures: This option allows you to download a ZIP file containing PDB-formatted files of the input and the cavities.
- Download Results: You can obtain a TOML-formatted file containing characterizations (volume, area, average depth, maximum depth, average hydropathy, and interface residues surrounding the cavities) of the detected cavities and the parameters used in the cavity analysis. A detailed description of the TOML-formatted file is available in the Help tab.
- View: Activate an interactive window for visualizing the cavities within the target biomolecular structure.


Additionally, you can download characterizations in Excel and PDF format by clicking on the Excel and PDF buttons in the DataTable toolbar, respectively.


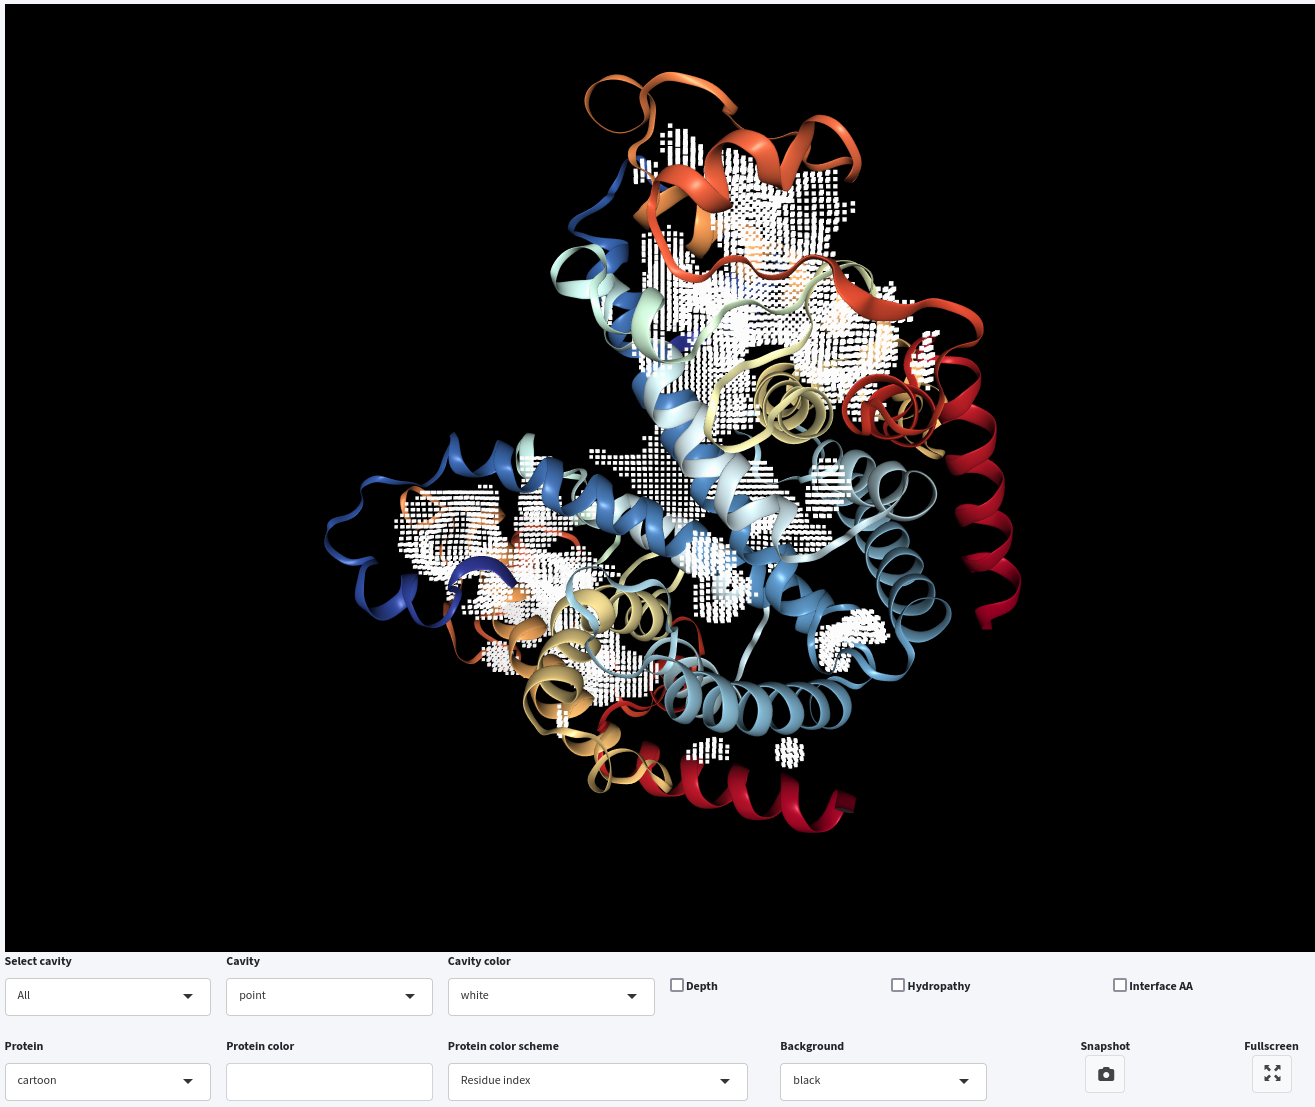
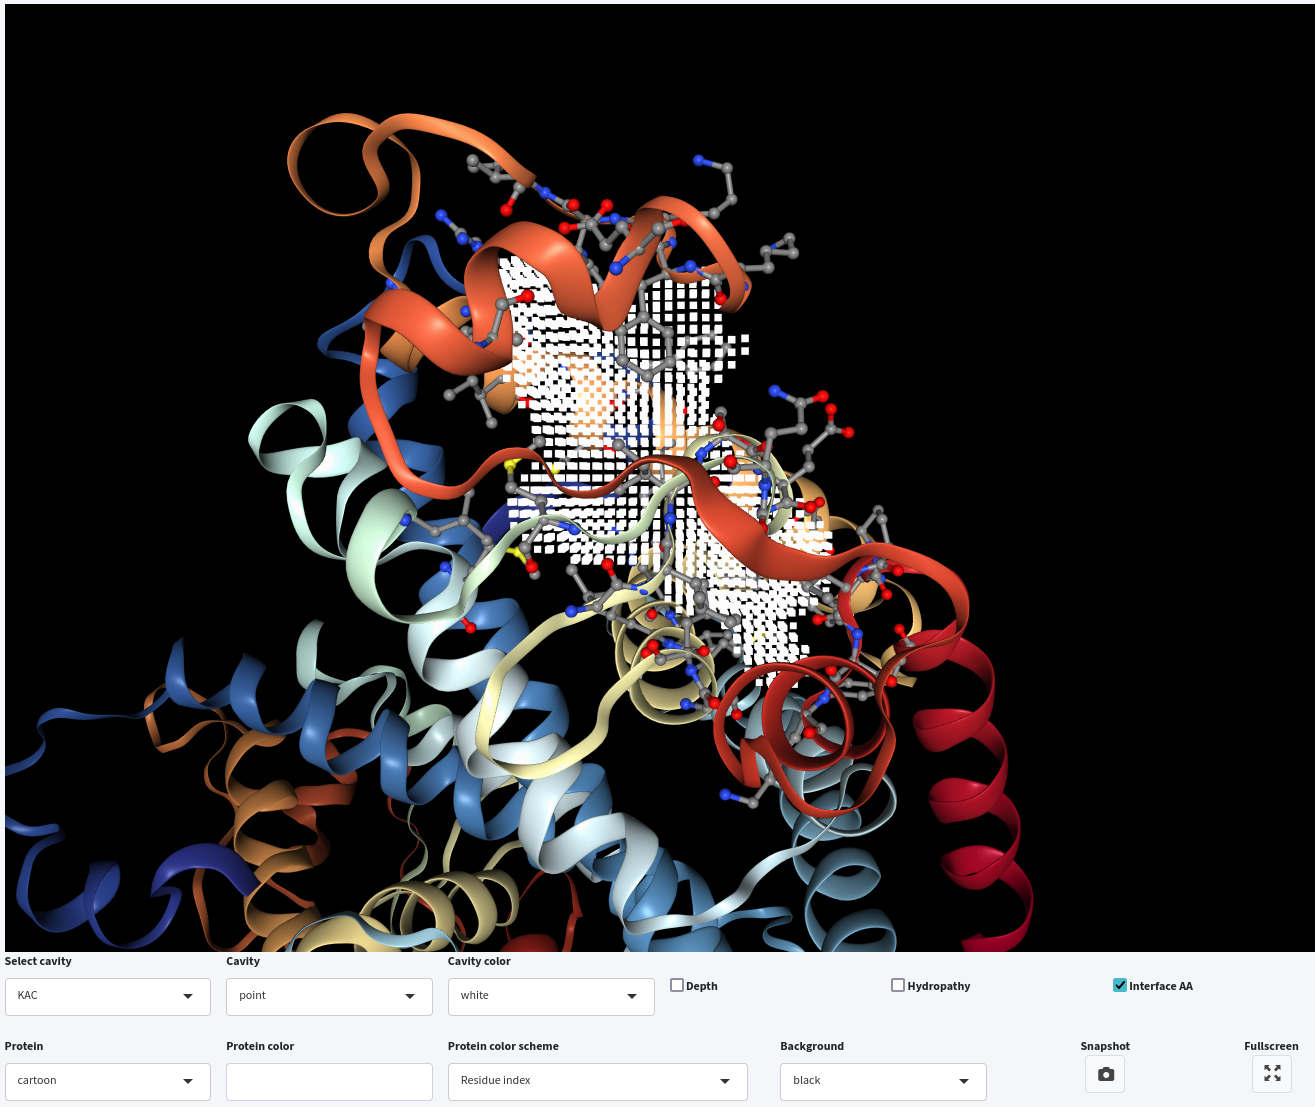
Furthermore, you can select a specific cavity for visualization in the interactive window by clicking on its corresponding name in the Select cavity drop-down menu. For example, we have selected KAC from the Select cavity drop-down menu.
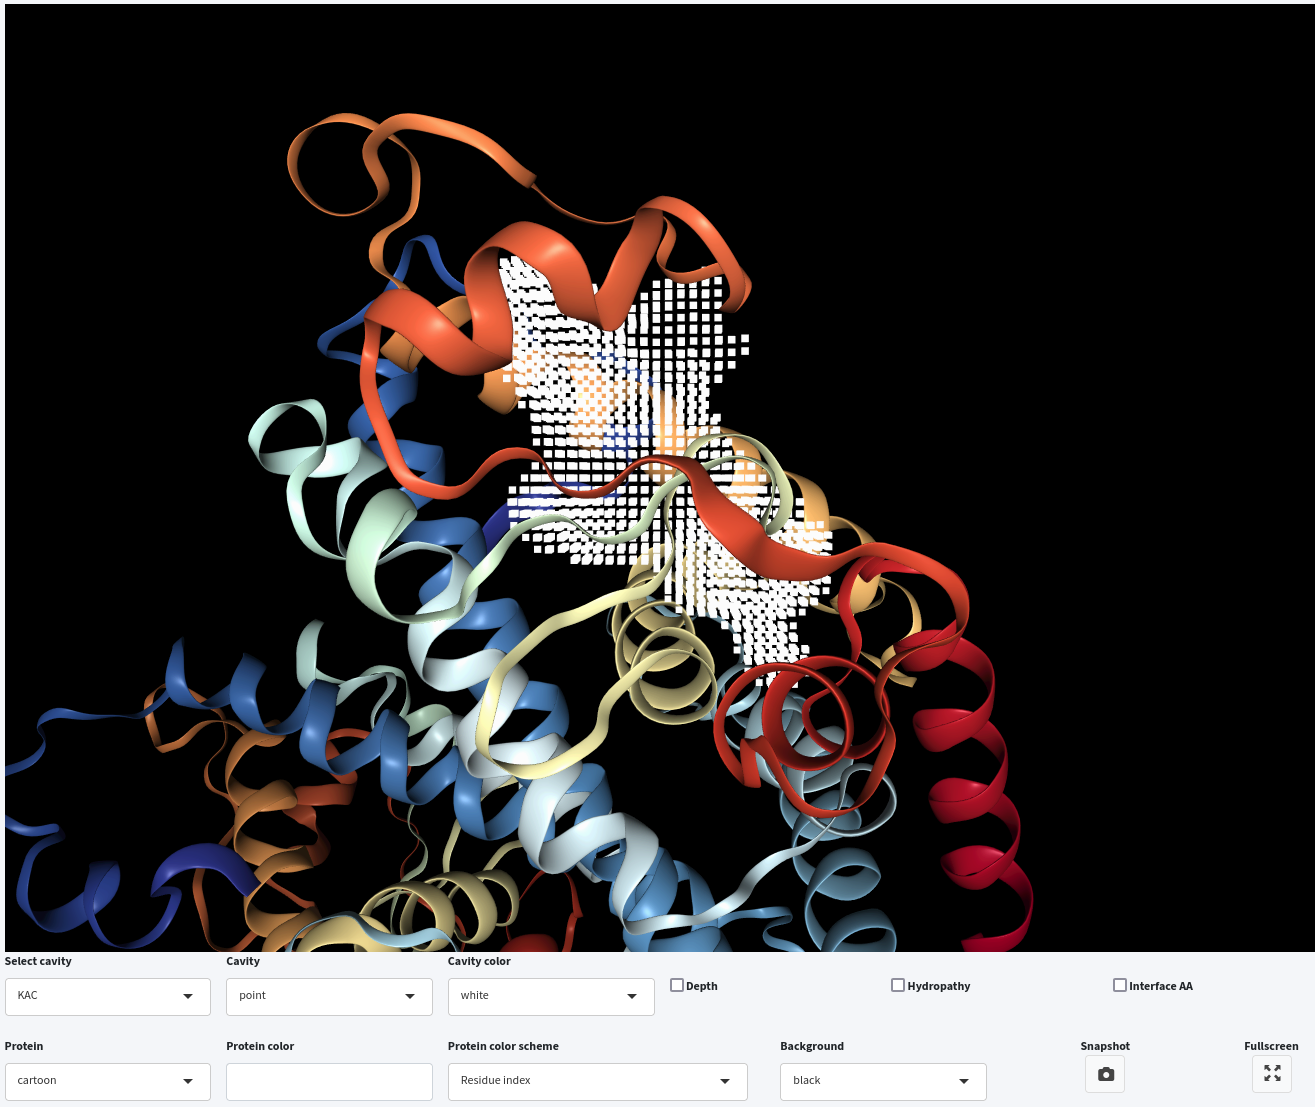
You can also display the interface residues surrounding the selected cavities by clicking on the Interface AA checkbox.
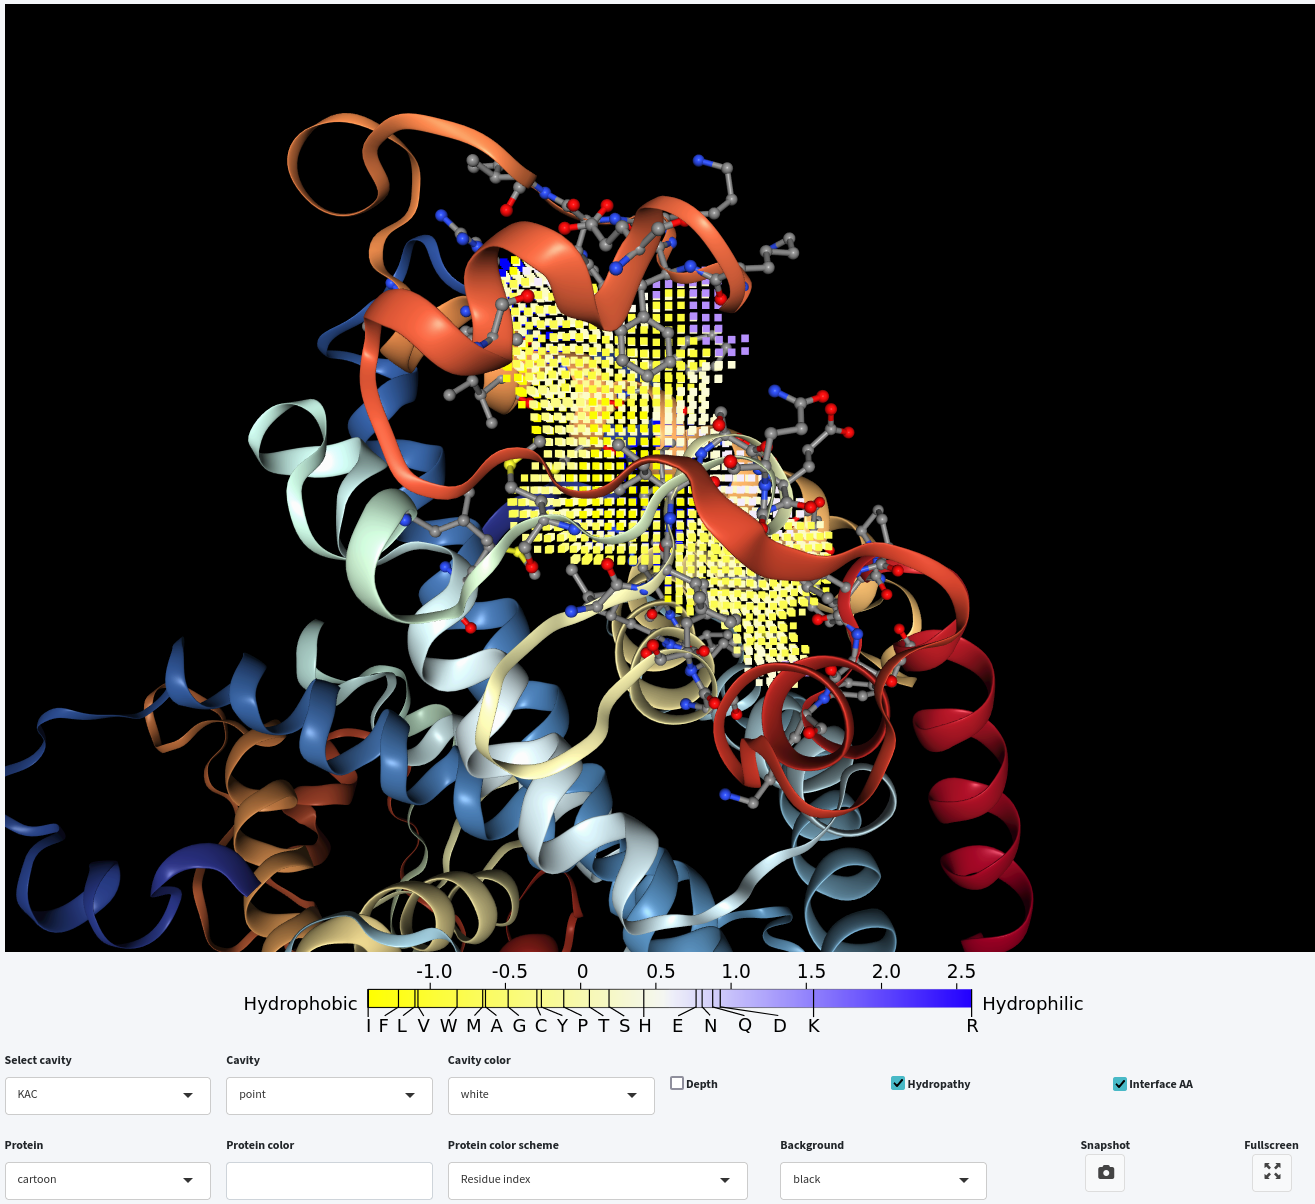
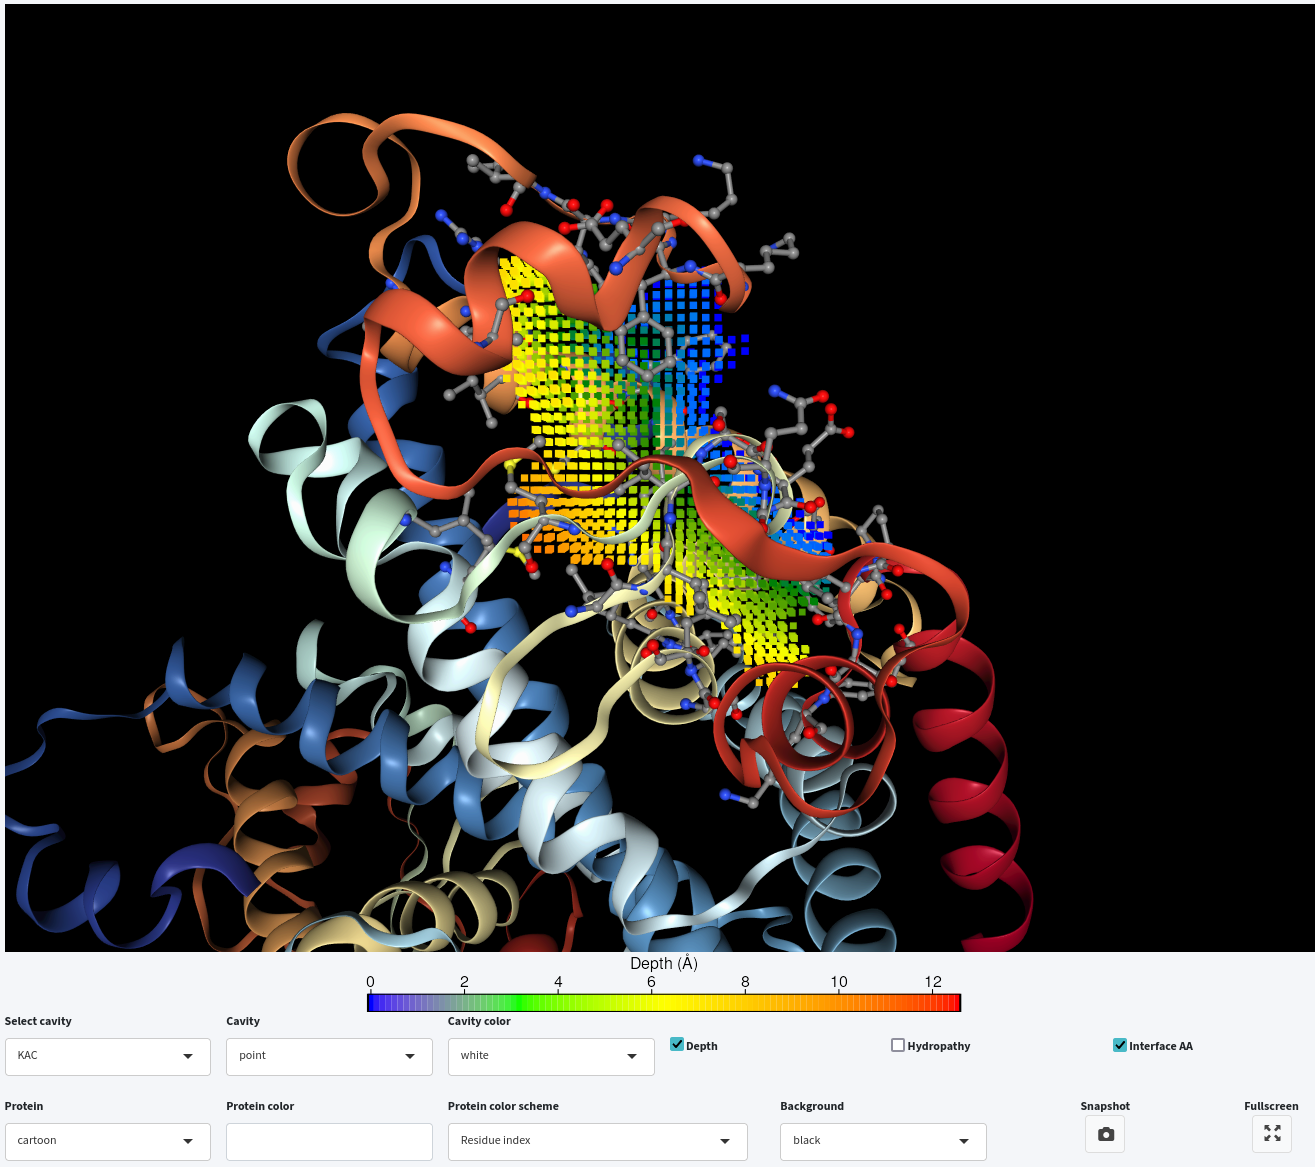
Lastly, you can either display the depth or hydropathy by clicking on the Depth or Hydropathy checkbox, respectively. However, only one of them can be displayed at a time, while you can combine either with interface residue visualization.
2. Whole structure analysis with customized parameters
To use customized parameters, select Whole structure (customized) in Step 2. Choose run mode .
KVFinder-web empowers users to customize detection parameters for the parKVFinder software (v1.2.0). Detailed explanations of these parameters and their impact on cavity detection can be found in the Help tab. In summary:
- Probe In: defines the biomolecular surface, i.e., the inner limits of cavities;
- Probe Out: defines the outer limits of cavities;
- Removal Distance: specifies the length to be removed from the cavity-bulk boundary;
- Volume Cutoff: excludes cavities with volumes smaller than the specified limit.
To illustrate the effect of changing these parameters, let us experiment with Volume Cutoff , Probe Out , and Removal Distance :
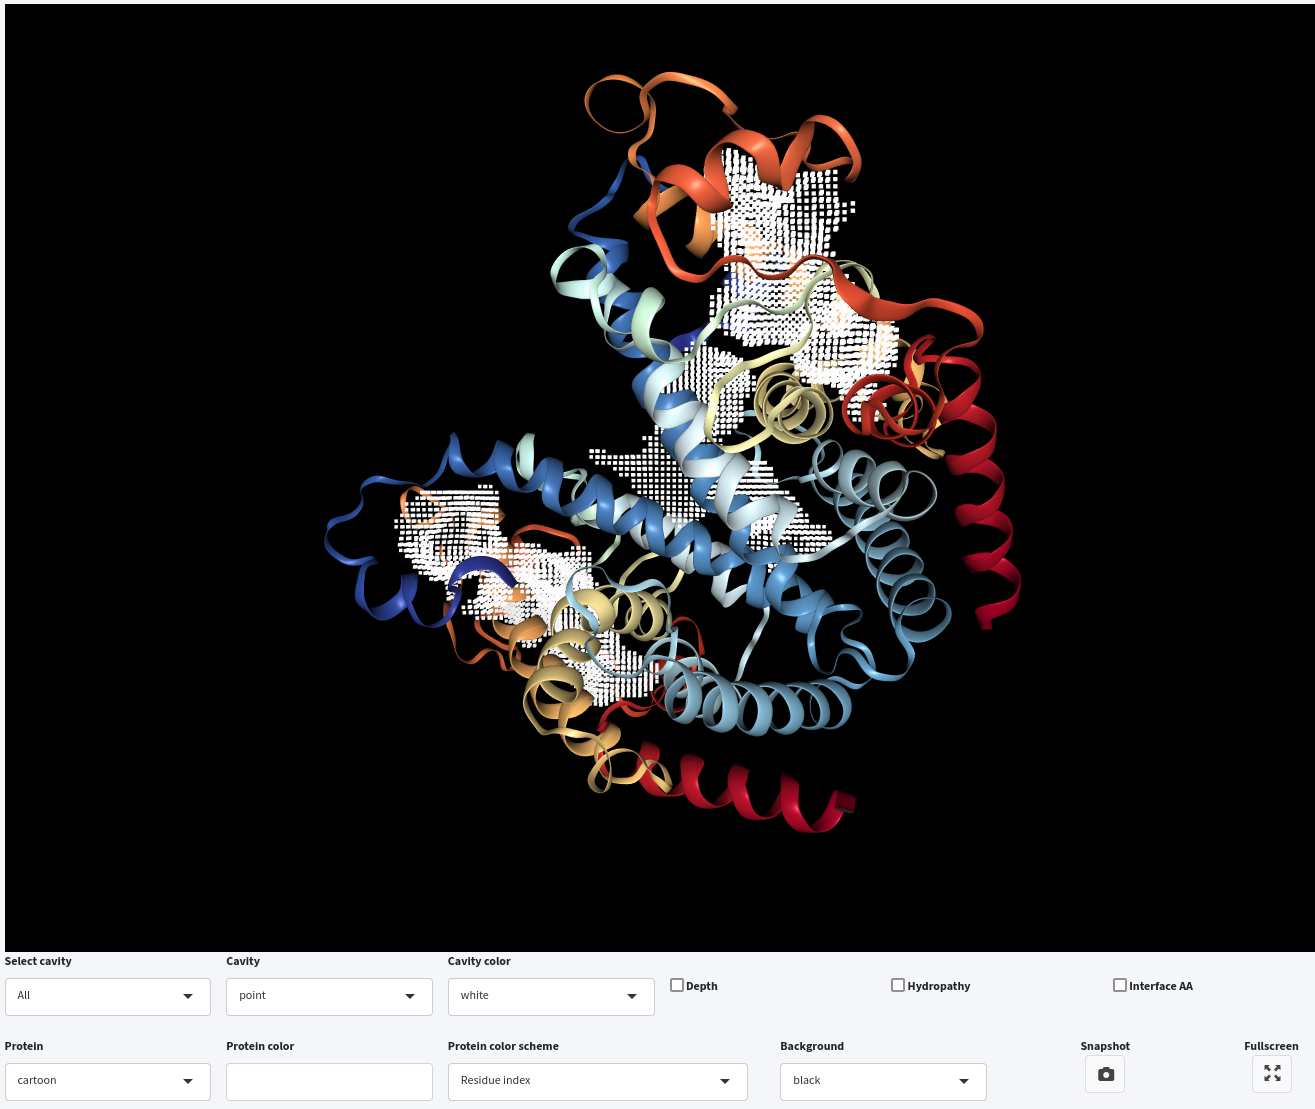
- Adjusting Volume Cutoff: Setting Volume Cutoff to 500 ų excludes smaller cavities are excluded from detection. After submitting the job and viewing the results using the View button, we can see that fewer cavities are identified compared to the detection with default parameters.
- Adjusting Probe Out: Increasing the Probe Out size to 8.0 Šwhile keeping Volume Cutoff at 500 ų results in cavities with a higher boundary compared to those detected with a 4.0 Šprobe. Therefore, by increasing the size of Probe Out , the cavity-bulk boundary is also raised.
- Adjusting Removal Distance: Apart from modyfing the Probe Out size, we can also adjust the Removal Distance to alter the cavity-bulk boundary. Setting Removal Distance to 1.2 Å, with Probe Out at 4.0 Å and Volume Cutoff at 500 ų, results in cavities with a higher boundary than those detected with a 2.4 Å Removal Distance . Therefore, reducing the Removal Distance also raises the cavity-bulk boundary.
In conclusion, altering the cavity boundary by varying Probe Out and Removal Distance also influences cavity segregation.
Steered Detection
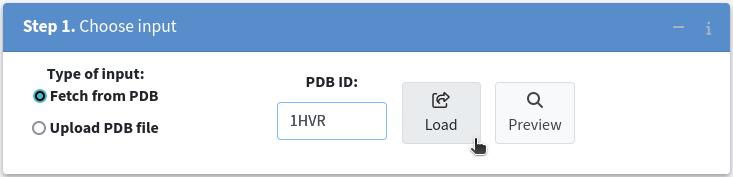
Another significant feature of parKVFinder is the ability to steer the detection of cavities. To demonstrate this, we will analyze the HIV-1 protease structure (PDB ID: 1HVR) instead of the PPAR-gamma structure (PDB ID: 1PRG). To do this, replace 1PRG with 1HVR in Step 1. Choose input and click the Load button once more.
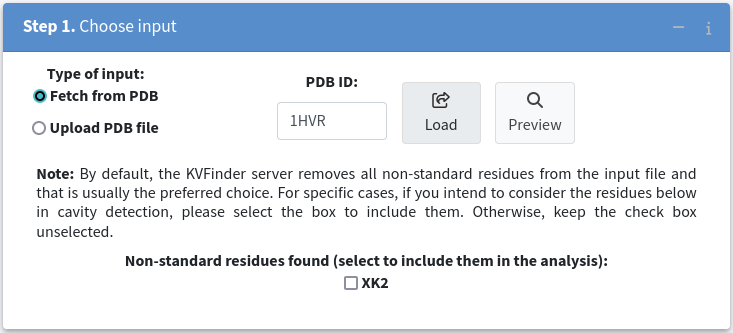
Once the structure is successfully loaded, you can further refine your analysis by excluding specific molecules, such as the HIV-1 protease inhibitor XK2, by leaving the corresponding checkbox unchecked.
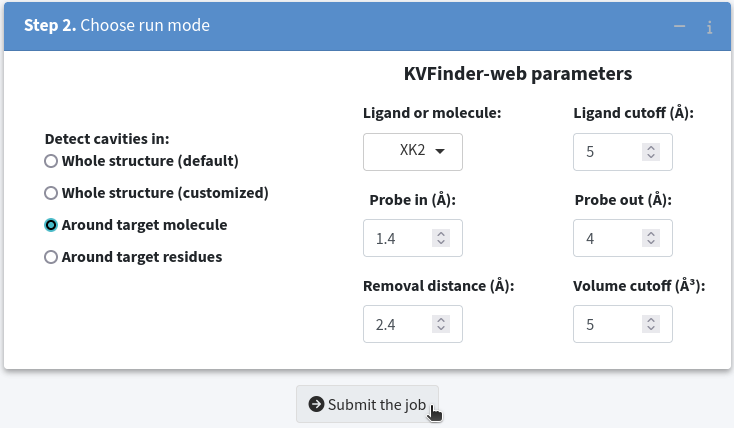
3. Around target molecule
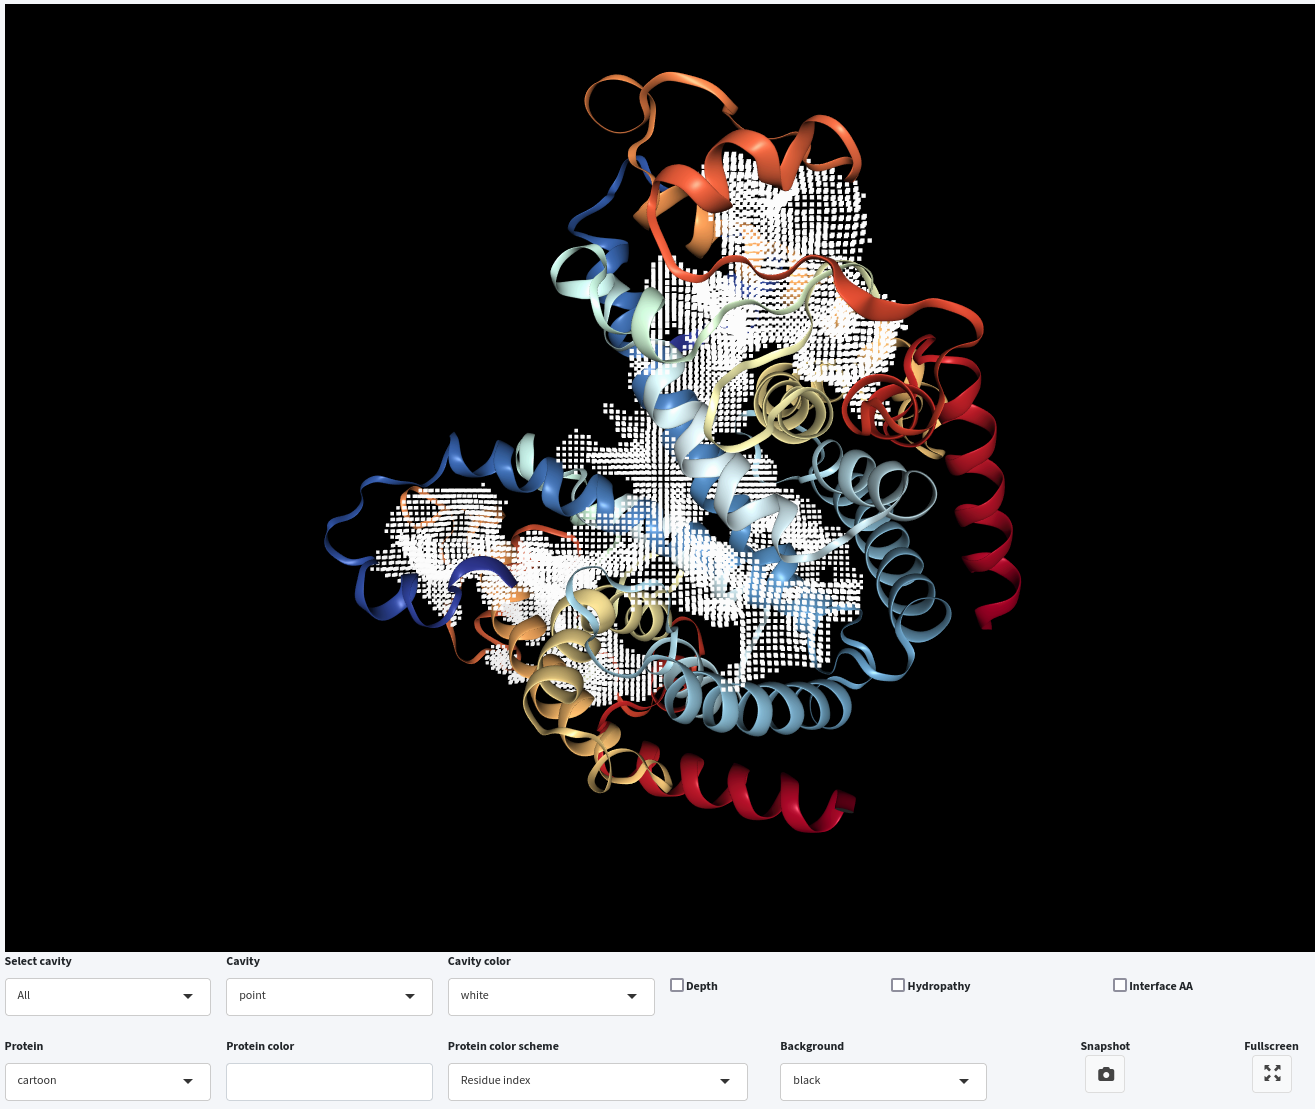
In this section, we will explore a method of cavity segmentation that limits the search around a specific structure. We will use this method to detect the cavities of HIV-1 protease while focusing on its inhibitor.
To begin, select Around target molecule in Step 2. Choose run mode . Next, select the XK2 option in the Ligand or molecule selection box. Then, submit the job to the KVFinder-web service.
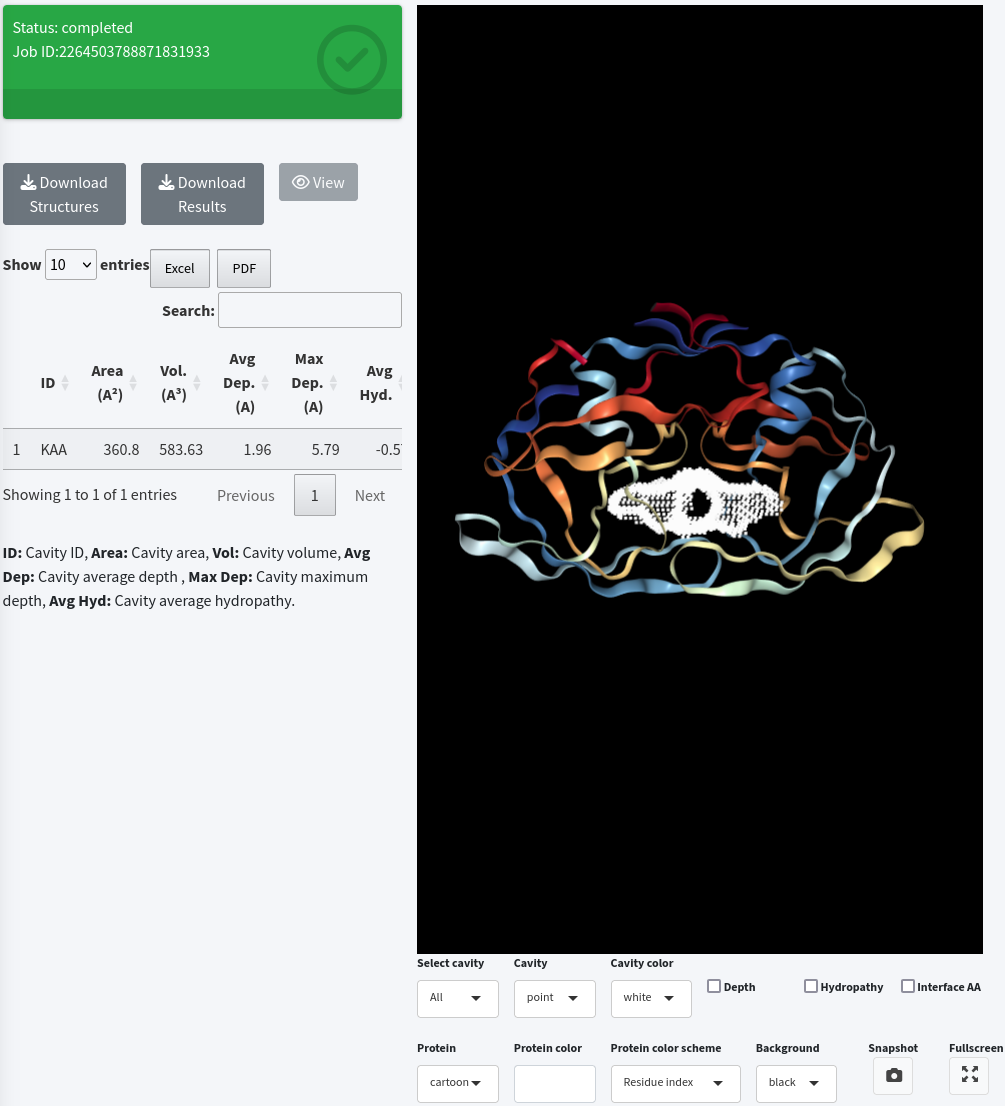
Once the job is completed, click on the View button to display the job results.
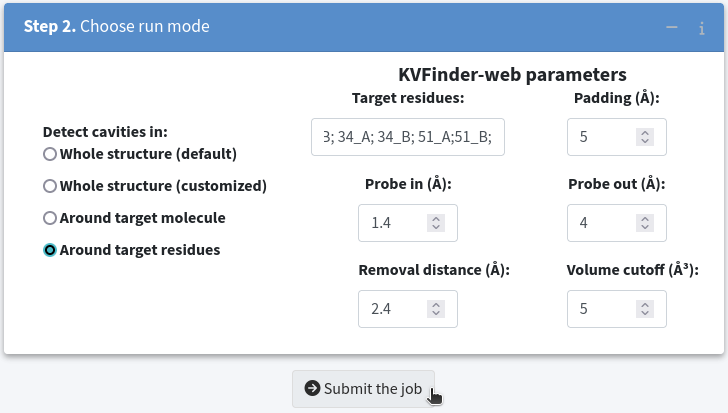
4. Around target residues
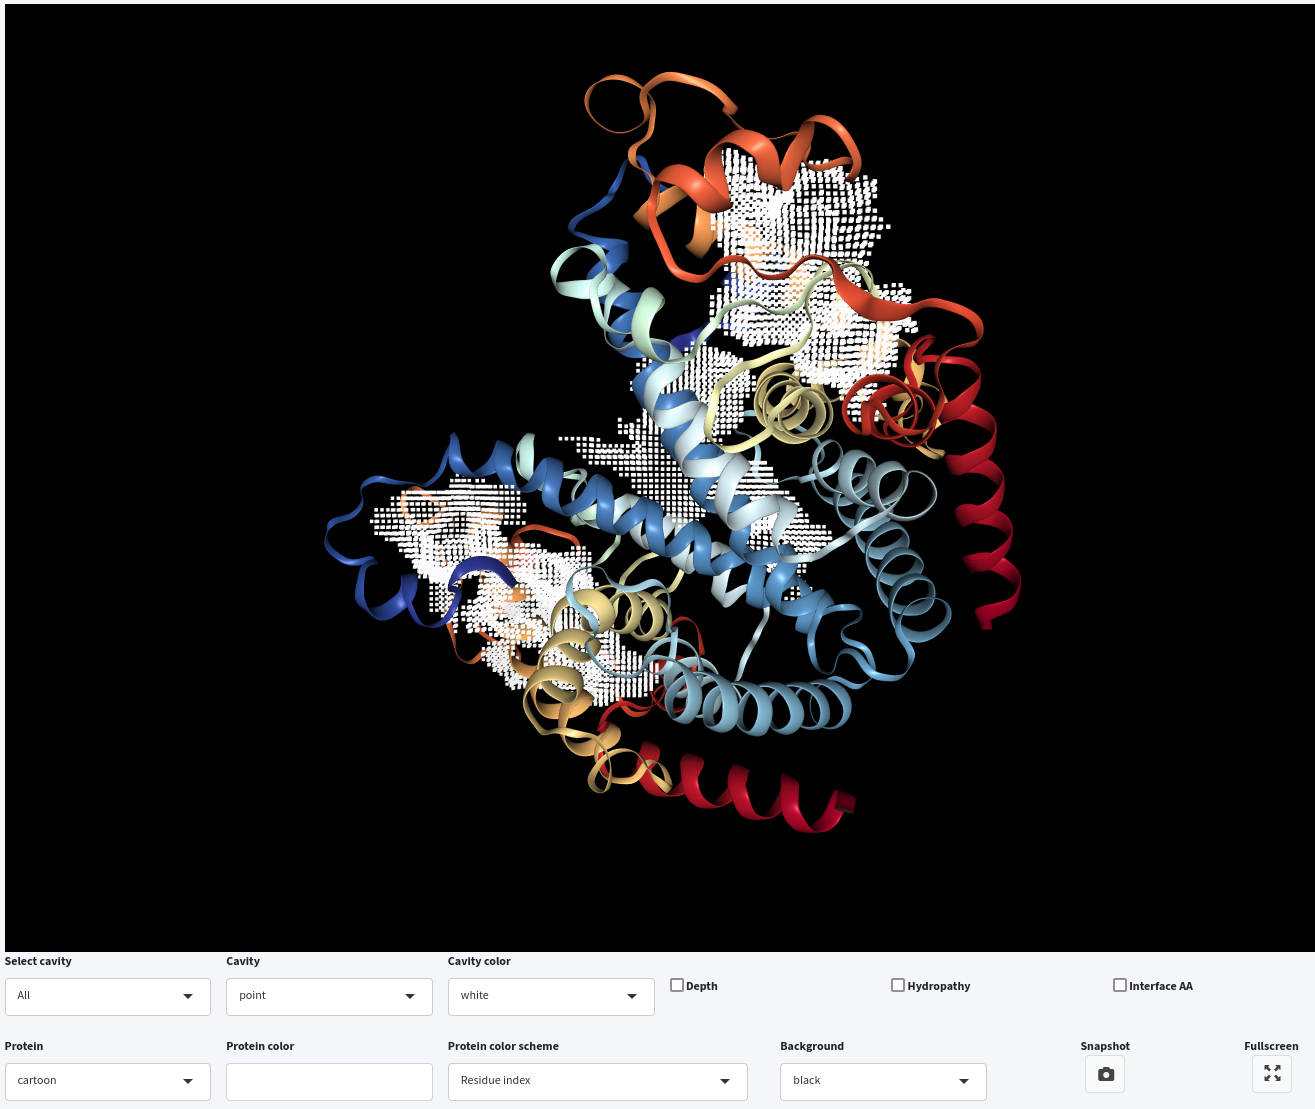
This method enables us to confine the search around a defined region using a custom box created based on a selection of residues and a specified padding. Let us detect cavities once more, but this time restrict the search space to include residues 27_A;27_B;34_A;34_B;51_A;51_B; with a Padding of 5.0 Å. Then, submit the job to KVFinder-web service.
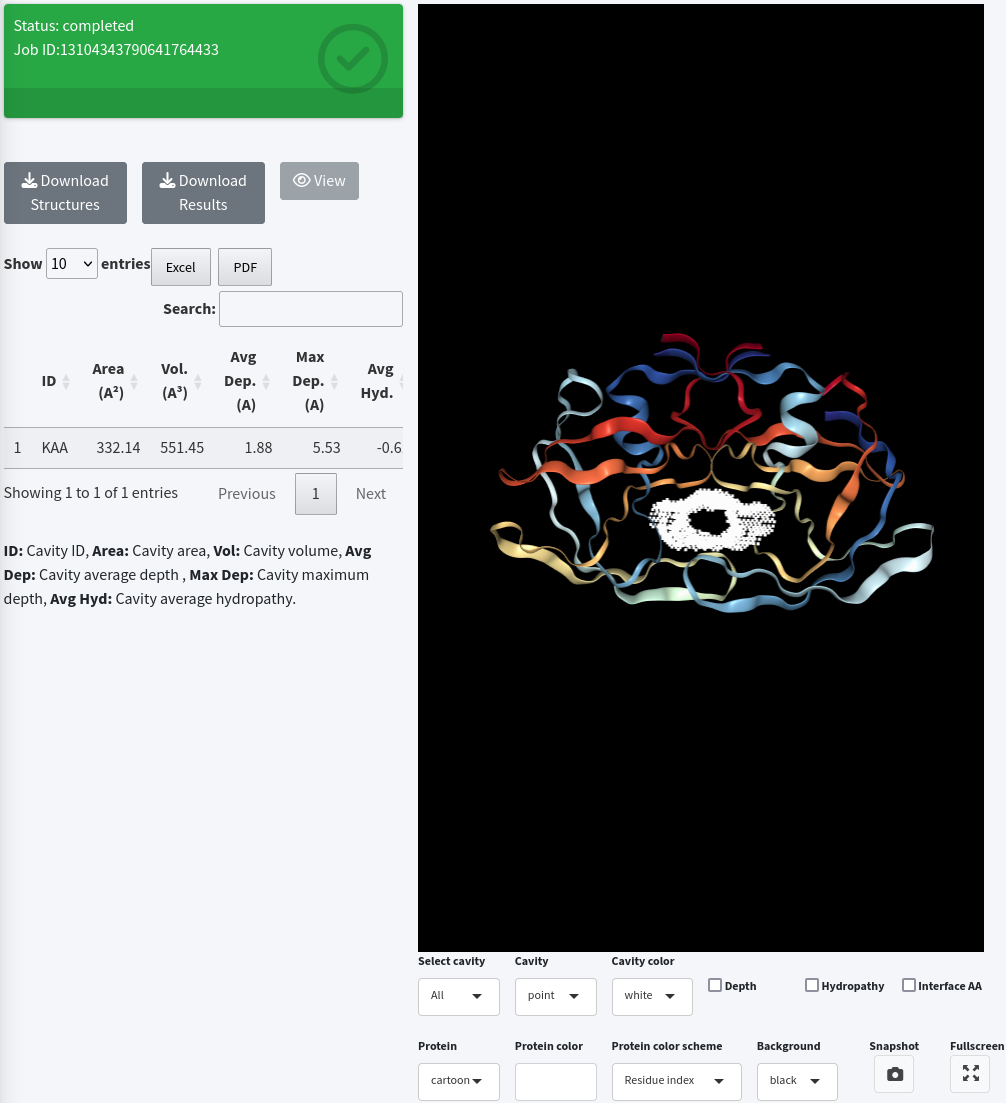
Once the job is completed, check the job results by clicking the View button.
Submitting an already sent job
When a job has been submitted to the KVFinder-web service and is still available, the Status field will already be shown as completed .

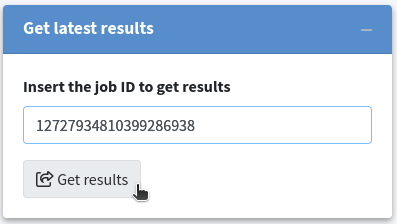
Retrieving a Job by ID
Users can effortlessly share their job results with colleagues by providing them with the job ID. To retrieve a job, go to the Retrieve results tab and enter the Job ID in the Insert the job ID to get results text box. Then, click the Get results button. For instance, use 12727934810399286938 (the ID of our first job in this tutorial).
If the job is still available on the KVFinder-web service, a field will appear displaying the Job ID Status. Once the job is completed, the Status field will change to completed and turn green. At this point, three buttons and a table displaying cavity characterizations will appear on the screen. To view the job results, simply click the View button.
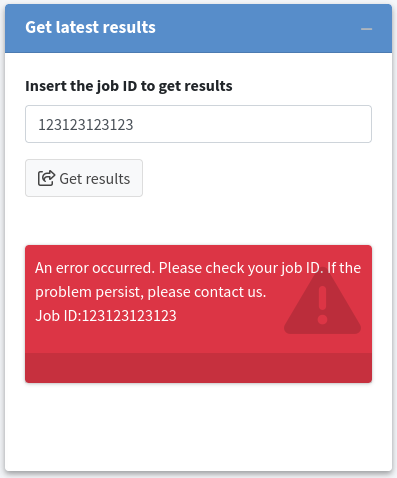
If the job does not exist or is no longer available on the KVFinder-web service, an error message will be displayed in the Status field.
Help
Overview
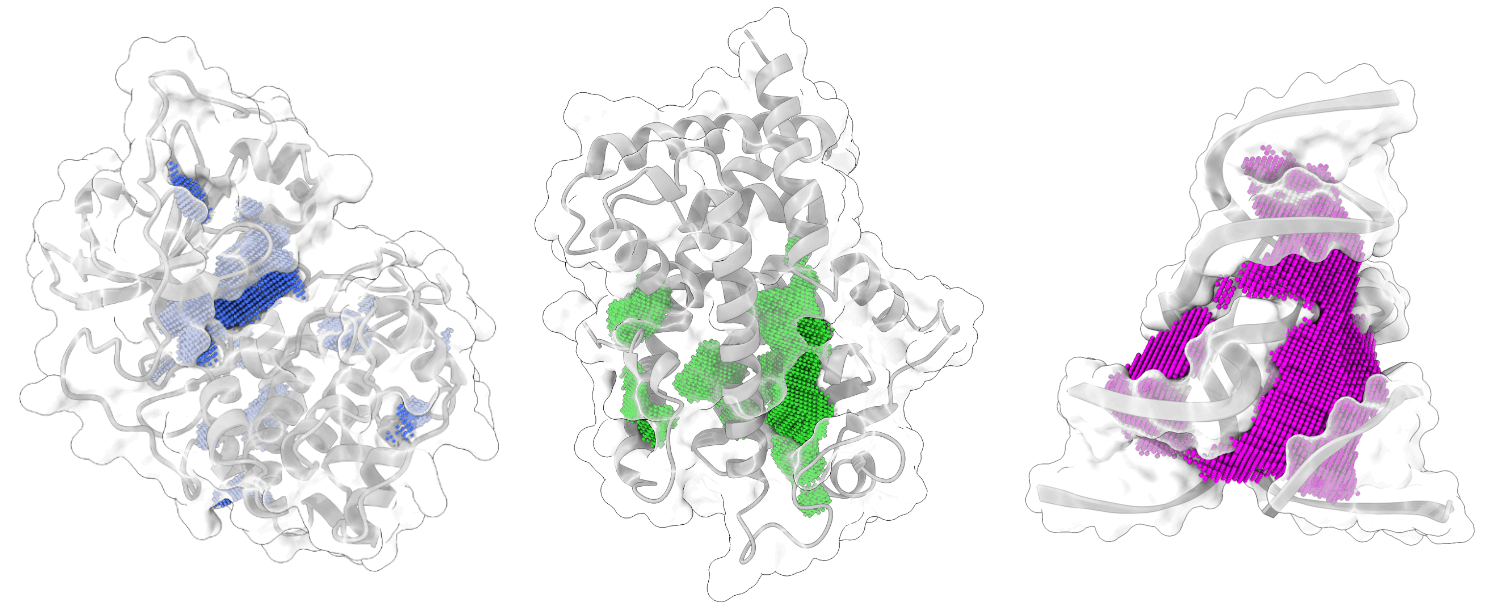
KVFinder-web is an open-source web-based application of an updated version of parKVFinder software ( v1.2.0 ) for cavity detection and characterization of any type of biomolecular structure, including but not limited to proteins and nucleic acids. KVFinder-web employs a geometric grid-and-sphere-based method with a dual-probe system for efficient cavity detection. The web-based application provides comprehensive characterizations, including shape, volume, area, depth, constitutional, and hydropathy informations. For a more detailed explanation, please refer to Oliveira et al. 2014 , Guerra et al. 2020 , Guerra et al. 2021 , and Guerra et al. 2023 .
Detection parameters
To detect cavities in biomolecular structures, KVFinder-web uses the following detection parameters:
- Probe In (Å): A smaller probe that defines the biomolecular surface by rolling around the target biomolecule. Typically, this is set to the size of a water molecule (1.4 Å).
- Probe Out (Å): A larger probe that defines inacessibility region, i.e., the cavities, and by rolling around the target biomolecule. Users can adjust the size of the probe based on the characteristics of the target structure.
- Removal Distance (Å): A length that is removed from the boundary between the cavity and bulk (solvent) region.
- Volume Cutoff (ų): A cavity volume filter to exclude cavities with smaller volumes than this limit. These smaller cavities are typically not relevant for function.
A schematic representation of cavity detection algorithm in KVFinder-web is presented below. It shows the process of detecting cavities within a biomolecular structure using probes and removal distance to define the cavity boundaries. In panel (A), a biomolecular structure X is inserted into a grid. In panel (B), Probe In (Pi) scans the surface of the structure, by translating over the grid points (orange). In panel (C), Probe Out (Po) scans the accessible points in blue. In panel (D), the cavity points (light grey) are defined as the difference between the probes' accessible points. The points not reached by Pi (dark grey) define the Solvent Excluded Surface (SES). In panel (E), a removal distance routine is applied to remove cavity points within a given distance from the cavity-bulk boundary (yellow line).
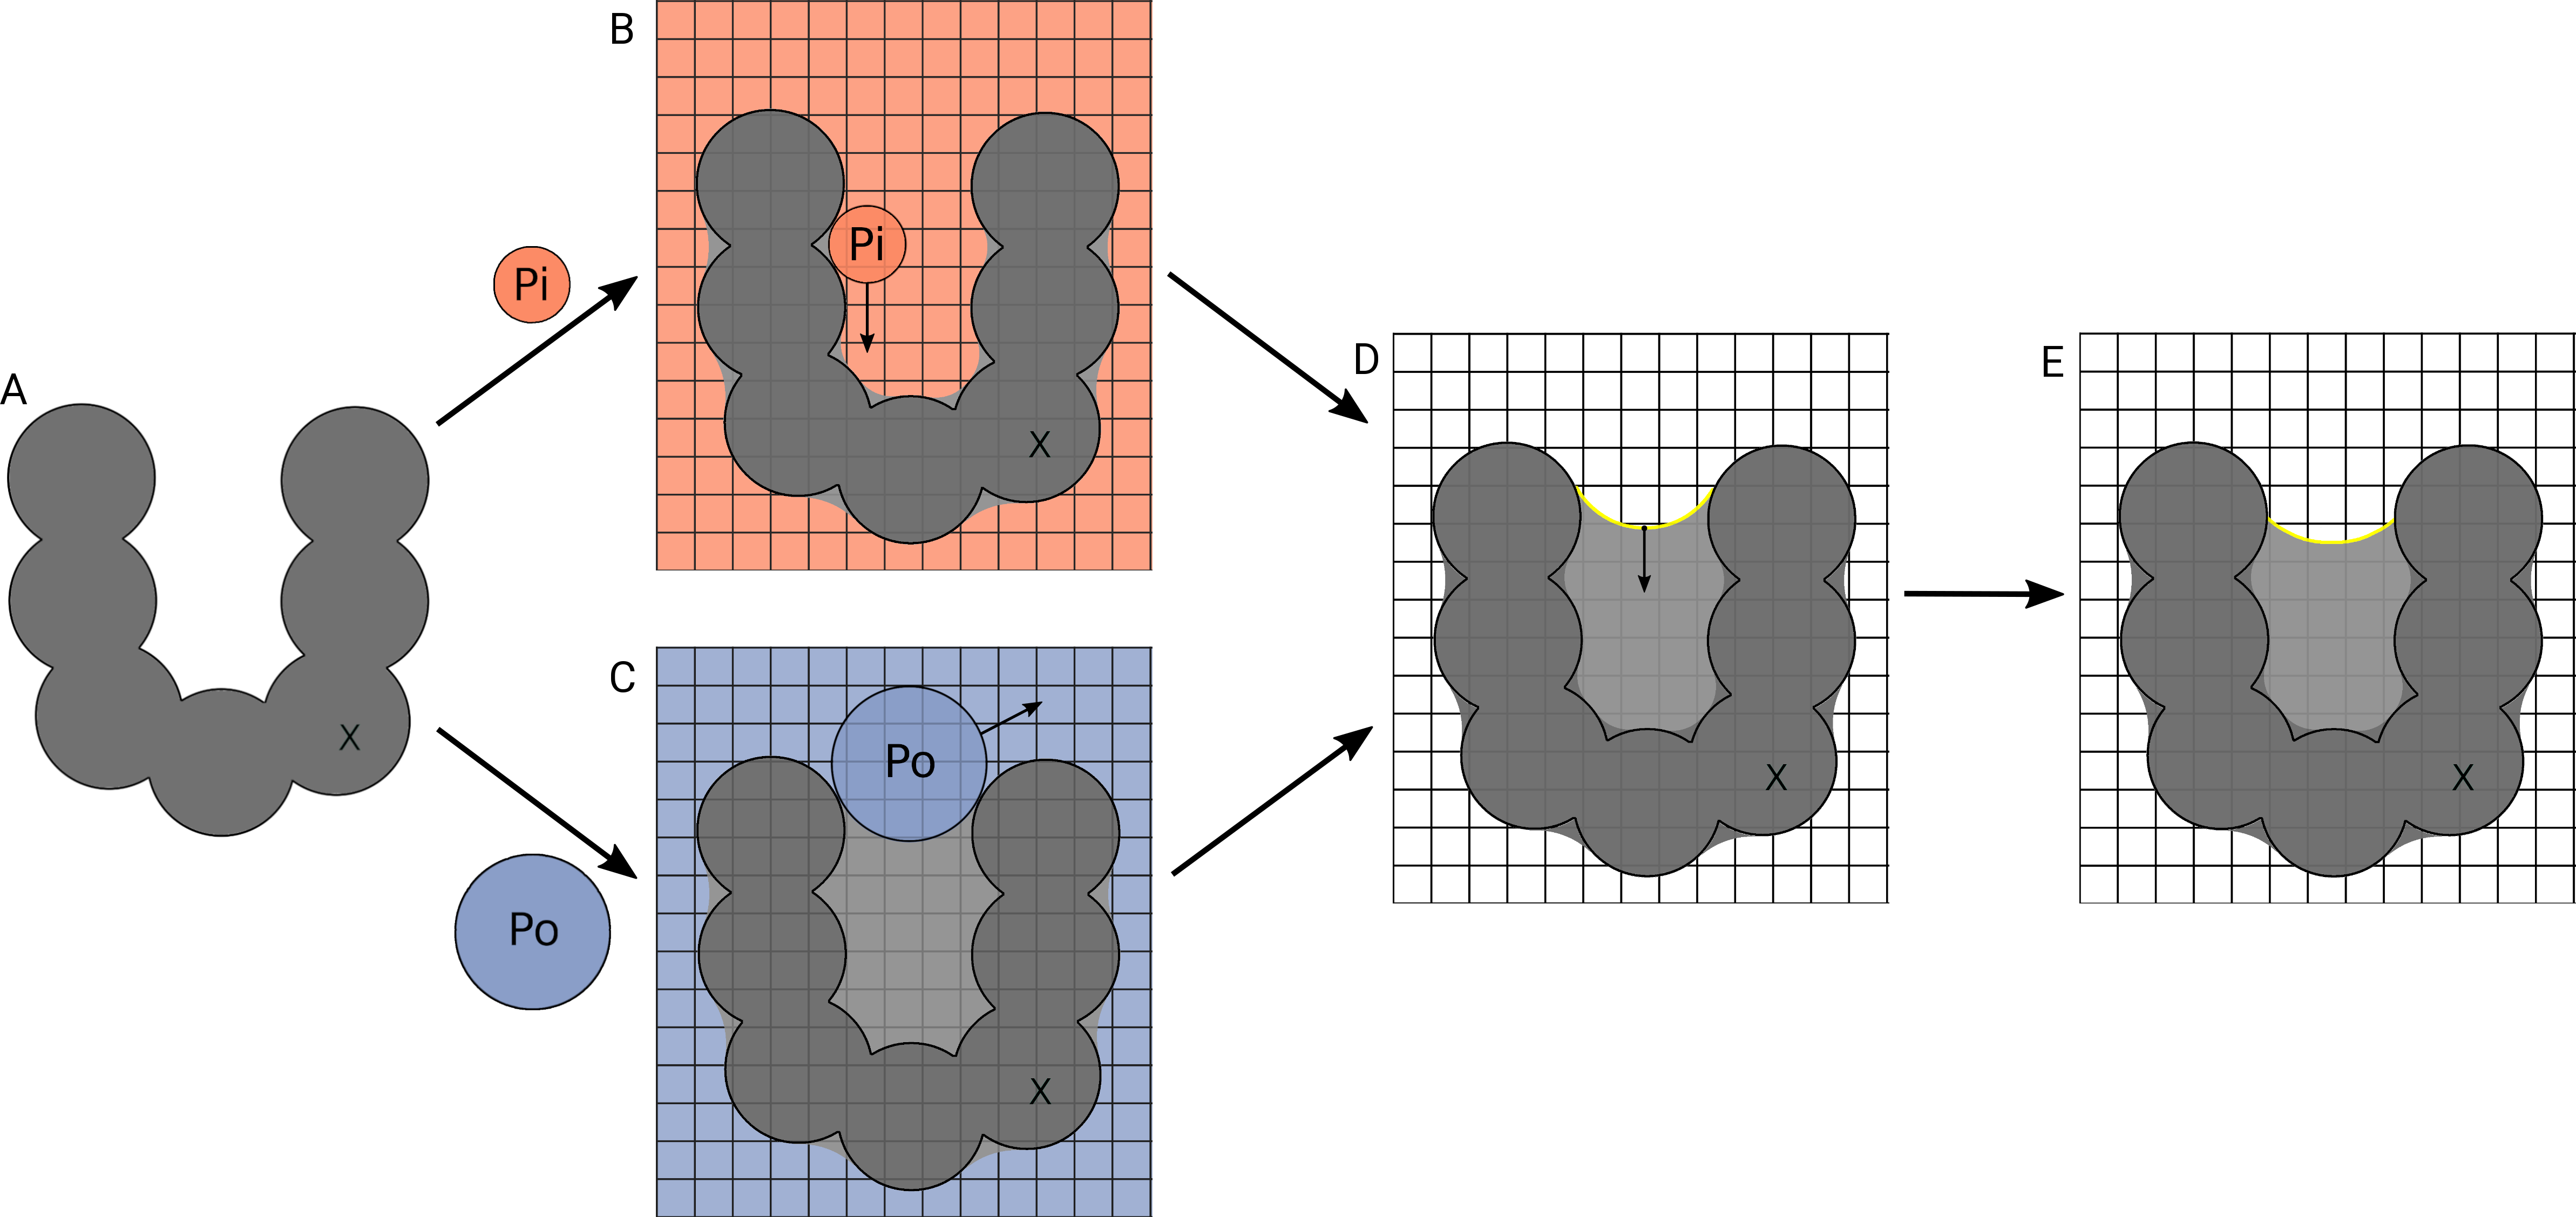
Source: Guerra et al. (2023) . Copyright 2023 American Chemical Society.
Impact of parameters on cavity detection
Two important parameters for cavity detection in KVFinder-web are Probe Out and Removal Distance , which directly affect execution time.
- Probe Out (Å): This larger probe defines the boundary between the cavity and the bulk (solvent) by systematically translating in a Cartesian grid around the target biomolecule. Larger Probe Out sizes reduce the degree of accessibility of the molecular surface, leading to longer calculation times.
- Removal Distance (Å): This parameter removes cavity points within a specified distance from the defined cavity-bulk boundary. Reducing the Removal Distance removes fewer points from the boundary, aiding in the segregation of sub-pockets and the detection of superficial cavities. Additionally, larger Removal Distance values lead to longer calculation times.
In addition to these parameters, KVFinder-web's execution time increases linearly with the number of atoms in the target biomolecule within the 3D grid. However, users can control the number of atoms by defining a custom search space around the ligand/molecule or residues, which can reduce execution time.
Cavity naming convention
Cavities in KVFinder suite (parKVFinder, pyKVFinder, and KVFinder-web) are named based on integer labels assigned to each cavity in the 3D grid. The first cavity identified is labeled as KAA, the second as KAB, the third as KAC, and so on. These labels are assigned using a DFS clustering algorithm, which identifies cavities in the order they are found in the 3D grid. Specific labels used in the algorithm include:
- -1: bulk (solvent);
- 0: biomolecule;
- 1: empty space (cavities that do not reach the volume cutoff);
- >1: cavities.
TOML-formatted results file
KVFinder-web generates results in TOML (Tom's Obvious, Minimal Language) format, providing information about job details, detection parameters, and cavity characterizations (i.e., volume, area, depth, constitutional and hydropathy). TOML is a text format that conveniently maps to a hash table, making it easy to parse in various programming languages. For a comprehensive guide on TOML format, please refer to https://toml.io/en/ .
Here's a concise description of the contents within this TOML-formatted file:
- CREATE_TIME: A timestamp indicating the GMT date and time when the job was created. It follows the 'YYYY-MM-DDTHH:MM:SS.SSSSSSSSSZ' format.
- ID: A unique identifier assigned to the job within the KVFinder-web service.
-
PARAMETERS:
Identifies the list of parameters used in the cavity
detection process.
- cutoffs: Identifies the list of cutoffs used during the cavity detection process.
- ligand_cutoff: Defines a radius (Å) to restrict space around a target ligand.
- volume_cutoff: Sets a volume filter (ų) to exclude cavities with smaller volumes than this limit.
- removal_distance: Definies the length (Å) removed from the boundary between the cavity and bulk (solvent) region.
-
modes:
Idenitifies the execution modes used in parKVFinder
software (v1.2.0) for cavity detection.
- box_mode: Determines whether to use a custom box to define the search space.
- kvp_mode: Selects cavity representation mode for exporting points to PDB file. true option exports all cavity points, while false option filters out some internal points before exporting cavities. KVFinder-web fixes to false .
- ligand_mode: Specifies whether the search space is limited around a ligand or a molecule.
- resolution_mode: Indirectly defines the grid spacing used in the cavity detection process. It has three possible values: Low (0.6 Å), Medium (0.5 Å), and High (0.25 Å). KVFinder-web fixes to Low .
- surface_mode: Selects surface type to be considered. true option defines the Solvent Excluded Surface (SES), while false option defines the Solvent Accessible Surface (SAS). KVFinder-web fixes to true .
- whole_protein_mode: Determines whether the entire biomolecular structure is used as the search space.
-
probes:
Specifies the probes used in the cavity detection process.
- probe_in: Sets Probe In (Å) size that defines the biomolecular surface.
- probe_out: Sets Probe Out (Å) size, which identifies inaccesibility regions (i.e., the cavities).
- step_size: Defines the grid spacing (Å). In KVFinder-web, this is set to 0.0 Å, since Resolution mode is fixed at Low .
-
visiblebox:
Defines the coordinates of the vertices that shape the visible
3D grid. Only four points are required to define the search space.
- p1: Origin's x, y, z cooordiantes.
- p2: X-axis's x, y, z cooordiantes.
- p3: Y-axis's x, y, z cooordiantes.
- p4: Z-axis's x, y, z cooordiantes.
-
internalbox:
Specifies coordinates for the internal 3D grid, used for
calculations.
- p1: Origin's x, y, z cooordiantes.
- p2: X-axis's x, y, z cooordiantes.
- p3: Y-axis's x, y, z cooordiantes.
- p4: Z-axis's x, y, z cooordiantes.
-
RESULTS:
Provides a list of characterizations per cavity.
- AREA: Provides the cavity area (Ų) for each identified cavity (e.g., KAA, KAB, KAC).
- AVG_DEPTH: Provides the cavity average depth (Å) for each identified cavity (e.g., KAA, KAB, KAC).
- AVG_HYDROPATHY: Provides the cavity average hydropathy, rated on the Eisenberg & Weiss scale, for each cavity (e.g., KAA, KAB, KAC). The scale ranges from -1.42 (highly hydrophobic) to 2.6 (highly hydrophilic).
- MAX_DEPTH: Provides the cavity maximum depth (ų) for each identified cavity (e.g., KAA, KAB, KAC).
- RESIDUES: Enumerates the interface residues composing each cavity. Each element follows the format [Residue Number, Chain ID, Amino Acid] .
- VOLUME: Provides the cavity volume (ų) for each identified cavity (e.g., KAA, KAB, KAC).
Depth characterization
Depth characterization assesses the degree of burial of the binding site, with the largest and deepest cavity often corresponding to the active site in an enzymatic protein. This information can help identify the active site on the molecular surface.
A schematic representation of the depth characterization process is shown below, illustrating how it calculates the depth of each cavity point based on its proximity to the boundary points. A spatial filter is used to evaluate whether a cavity point (in black) is a direct neighbor (red point) of a bulk point, which assigns it as a boundary point (as shown in panel A of the schematic). The distance between the cavity point (in black) and the boundary points (in red) is then calculated (as shown in panel B of the schematic), and the shortest distance (indicated by the blue line) represents the depth of the cavity point. By calculating the depth of all cavity points, the maximum and average depths can be determined for each detected cavity.
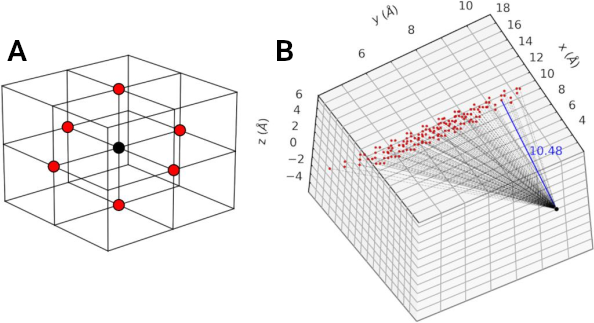
Source: Guerra et al. (2021) . License: CC BY 4.0 .
Hydropathy characterization
Hydropathy characterization provides valuable insights into the water attractiveness and types of interactions at the interface of the binding site.
A schematic represention of hydropathy characterization is shown below. The Eisenberg & Weiss hydrophobicity scale ranges from -1.42 (highly hydrophobic) to 2.6 (highly hydrophilic), projecting the value of the amino acid nearest to a target surface point. Panel A displays the hydrophobicity of each amino acid. The distances between a surface point (black) and the atoms (carbon: green; oxygen: red; nitrogen: blue; sulfur: yellow) of the amino acids (methionine: left; valine: right) are calculated, and the residue of the atom with the shortest distance (indicated by the red line) maps its hydrophobicity value onto it (as shown in panel B).
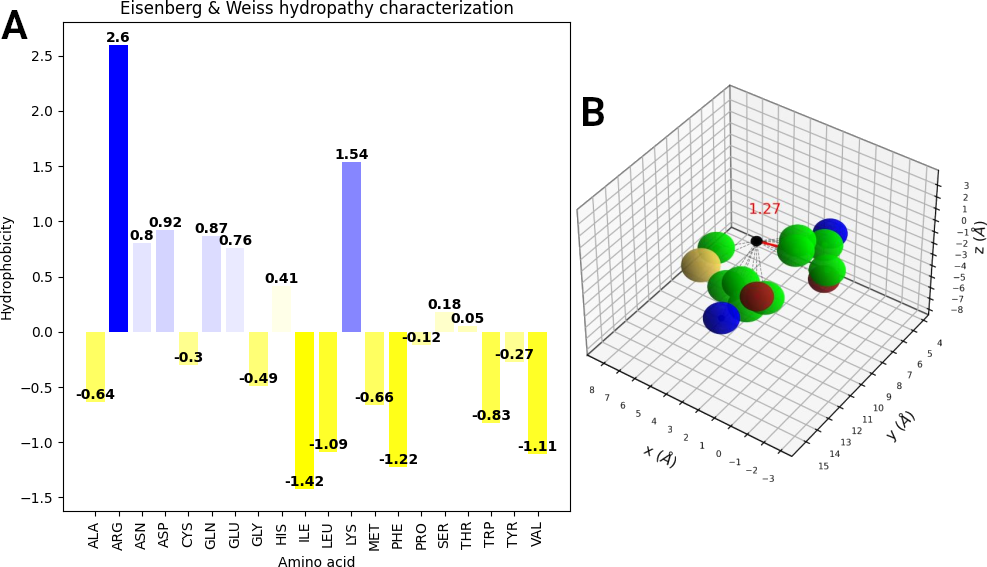
Source: Guerra et al. (2021) . License: CC BY 4.0 .
Requirements and limitations
The KVFinder-web service has a Job timeout of 30 minutes (the maximum time that an accepted job could run on the server). Completed jobs will be available on the web service up to 1 day after completion. The maximum payload (maximum size of the JSON) of the data sent to the KVFinder-web service is 5 MB.
Additionally, the KVFinder-web service has some limitations, compared to a local installation of parKVFinder, including:
- Probe In size must not exceed 5 Å to prevent unnecessary time-consuming jobs;
- Probe Out size must not exceed 50 Å to prevent unnecessary time-consuming jobs;
- Removal Distance must not exceed 10 Å to prevent unnecessary time-consuming jobs;
- The grid spacing is fixed to 0.6 Å to prevent unnecessary time-consuming jobs;
- Cavity representation will always be filtered (this reduces the space consumed by cavity files on the web service and conserves resources for NGL visualization).
This website is free and open to all users, and there is no login requirement.
About
The KVFinder suite
The KVFinder suite encompasses a toolkit of cavity detection and characterization software with various scopes, including:
KVFinder-web
KVFinder-web is an open-source web-based application of an updated version of parKVFinder software ( v1.2.0 ). It is designed for cavity detecting and characterizing cavities within diverse biomolecular structures, including but not limited to proteins and nucleic acids. KVFinder-web implements a geometric grid-and-sphere based method to detect cavities using a dual-probe system. It provides a comprehensive characterization of biomolecular cavities that includes spatial, depth, constitutional, and hydropathy information.
KVFinder-web consists of two independent components:
- A RESTful web service: KVFinder-web service
- A graphical web portal: KVFinder-web portal
Citing:
If you use KVFinder-web , please cite:
- João V.S. Guerra, Helder V. Ribeiro-Filho, José G.C. Pereira, and Paulo S. Lopes-de-oliveira. KVFinder-web: a web-based application for detecting and characterizing biomolecular cavities. Nucleic Acids Research, May 2023. URL: https://doi.org/10.1093/nar/gkad324 , doi:10.1016/10.1093/nar/gkad324.
- João Victor Da Silva Guerra, Helder Veras Ribeiro Filho, Leandro Oliveira Bortot, Rodrigo Vargas Honorato, José Geraldo De Carvalho Pereira, and Paulo Sérgio Lopes-de-oliveira. ParKVFinder: a thread-level parallel approach in biomolecular cavity detection. SoftwareX, 12:100606, July 2020. URL: https://doi.org/10.1016/j.softx.2020.100606 , doi:10.1016/j.softx.2020.100606.
If you use depth and hydropathy characterization, please also cite:
- João Victor da Silva Guerra, Helder Veras Ribeiro-Filho, Gabriel Ernesto Jara, Leandro Oliveira Bortot, José Geraldo de Carvalho Pereira, and Paulo Sérgio Lopes-de-Oliveira. pyKVFinder: an efficient and integrable python package for biomolecular cavity detection and characterization in data science. BMC Bioinformatics, December 2021. URL: https://doi.org/10.1186/s12859-021-04519-4 , doi:10.1186/s12859-021-04519-4.
parKVFinder
Parallel KVFinder (parKVFinder) is a robust open-source software
tailored to detect and comprehensively characterize biomolecular
cavities of all types. It offers detailed insights into the spatial,
depth, constitutional, and hydropathy characteristics of each cavity.
The software allows users to interact with an intuitive set of
customizable parameters via a graphical user interface (GUI) or a
command-line interface.
Each cavity is spatially characterized in terms of its shape, volume,
and surface area. Depth characterization reveals the depth of each
cavity point, displayed as B-factors, and computes average and maximum
depth per cavity. Constitutional characterization identifies the amino
acids constituting the identified cavities. Lastly, hydropathy
characterization maps the Eisenberg & Weiss hydrophobicity scale onto
the surface points of each cavity, represented as the Q-factor, and
estimates the average hydropathy for each cavity.
For more information on parKVFinder , please refer to: [2]
pyKVFinder
Cavity analysis often involves handling substantial data and
necessitates efficient scripting routines built on easily manipulable
data structures. Addressing this need, we developed Python-C Parallel
KVFinder (pyKVFinder), an open-source (GPL v3.0) Python package
designed for detecting and characterizing cavities in biomolecular
structures for data science and automated pipelines.
pyKVFinder employs a dual-probe algorithm to scan the biomolecular
structure within a regular 3D grid stored as an N-dimensional array
(ndarray). The software detects cavities and provides comprehensive
information regarding their spatial, depth, constitutional, and
hydropathy characteristics.
Specifically designed to streamline biostructural data analysis within
the Python ecosystem, pyKVFinder is a crucial asset for data science
and drug design applications. It excels in automated pipelines
requiring efficient and rapid processing of extensive datasets.
Researchers and developers can seamlessly manipulate and process
cavity data structures with pyKVFinder to extract valuable insights
and develop new drugs or biomolecular applications.
For more information on pyKVFinder , please refer to: [3]
Development Team
The following team develops and maintains KVFinder-web:
- João V. S. Guerra
- Helder V. Ribeiro-Filho
- José G. C. Pereira
- Paulo S. Lopes-de-Oliveira
KVFinder-web is hosted at the Brazilian Biosciences National Laboratory ( LNBio ) under the Brazilian Center for Research in Energy and Materials ( CNPEM )
Contact
For questions, inquiries, or contributions to the KVFinder suite, please contact us via email at joao.guerra@lnbio.cnpem.br or psloliveira1@gmail.com .
Troubleshooting
If you encounter any issues or have requests related to the KVFinder-web, please inform us to facilitate improvements. Our project is managed on GitHub, and you can use our Issues page to:
Before submitting your report or request, please search for keywords to ensure that it has not already been reported.
Funding
KVFinder-web software was supported by Fundação de Amparo à Pesquisa do Estado de São Paulo (FAPESP) [Grant Number 2018/00629-0], Brazilian Biosciences National Laboratory (LNBio) and Brazilian Center for Research in Energy and Materials (CNPEM).
License
The KVFinder-web software is licensed under the terms of the Apache-2.0 License and is distributed in the hope that it will be useful, but WITHOUT ANY WARRANTY; without even the implied warranty of MERCHANTABILITY or FITNESS FOR A PARTICULAR PURPOSE. See the Apache-2.0 License for more details.